Numbers that agree with each other.
When tickets, time and billing live in three systems, every report is a reconciliation exercise and every number is arguable. Tantivo computes its metrics live against one data model — so utilisation, revenue and SLA are reading the same rows.
- Computed live, not nightly
- One data model, no reconciliation
- Tenant-isolated by construction
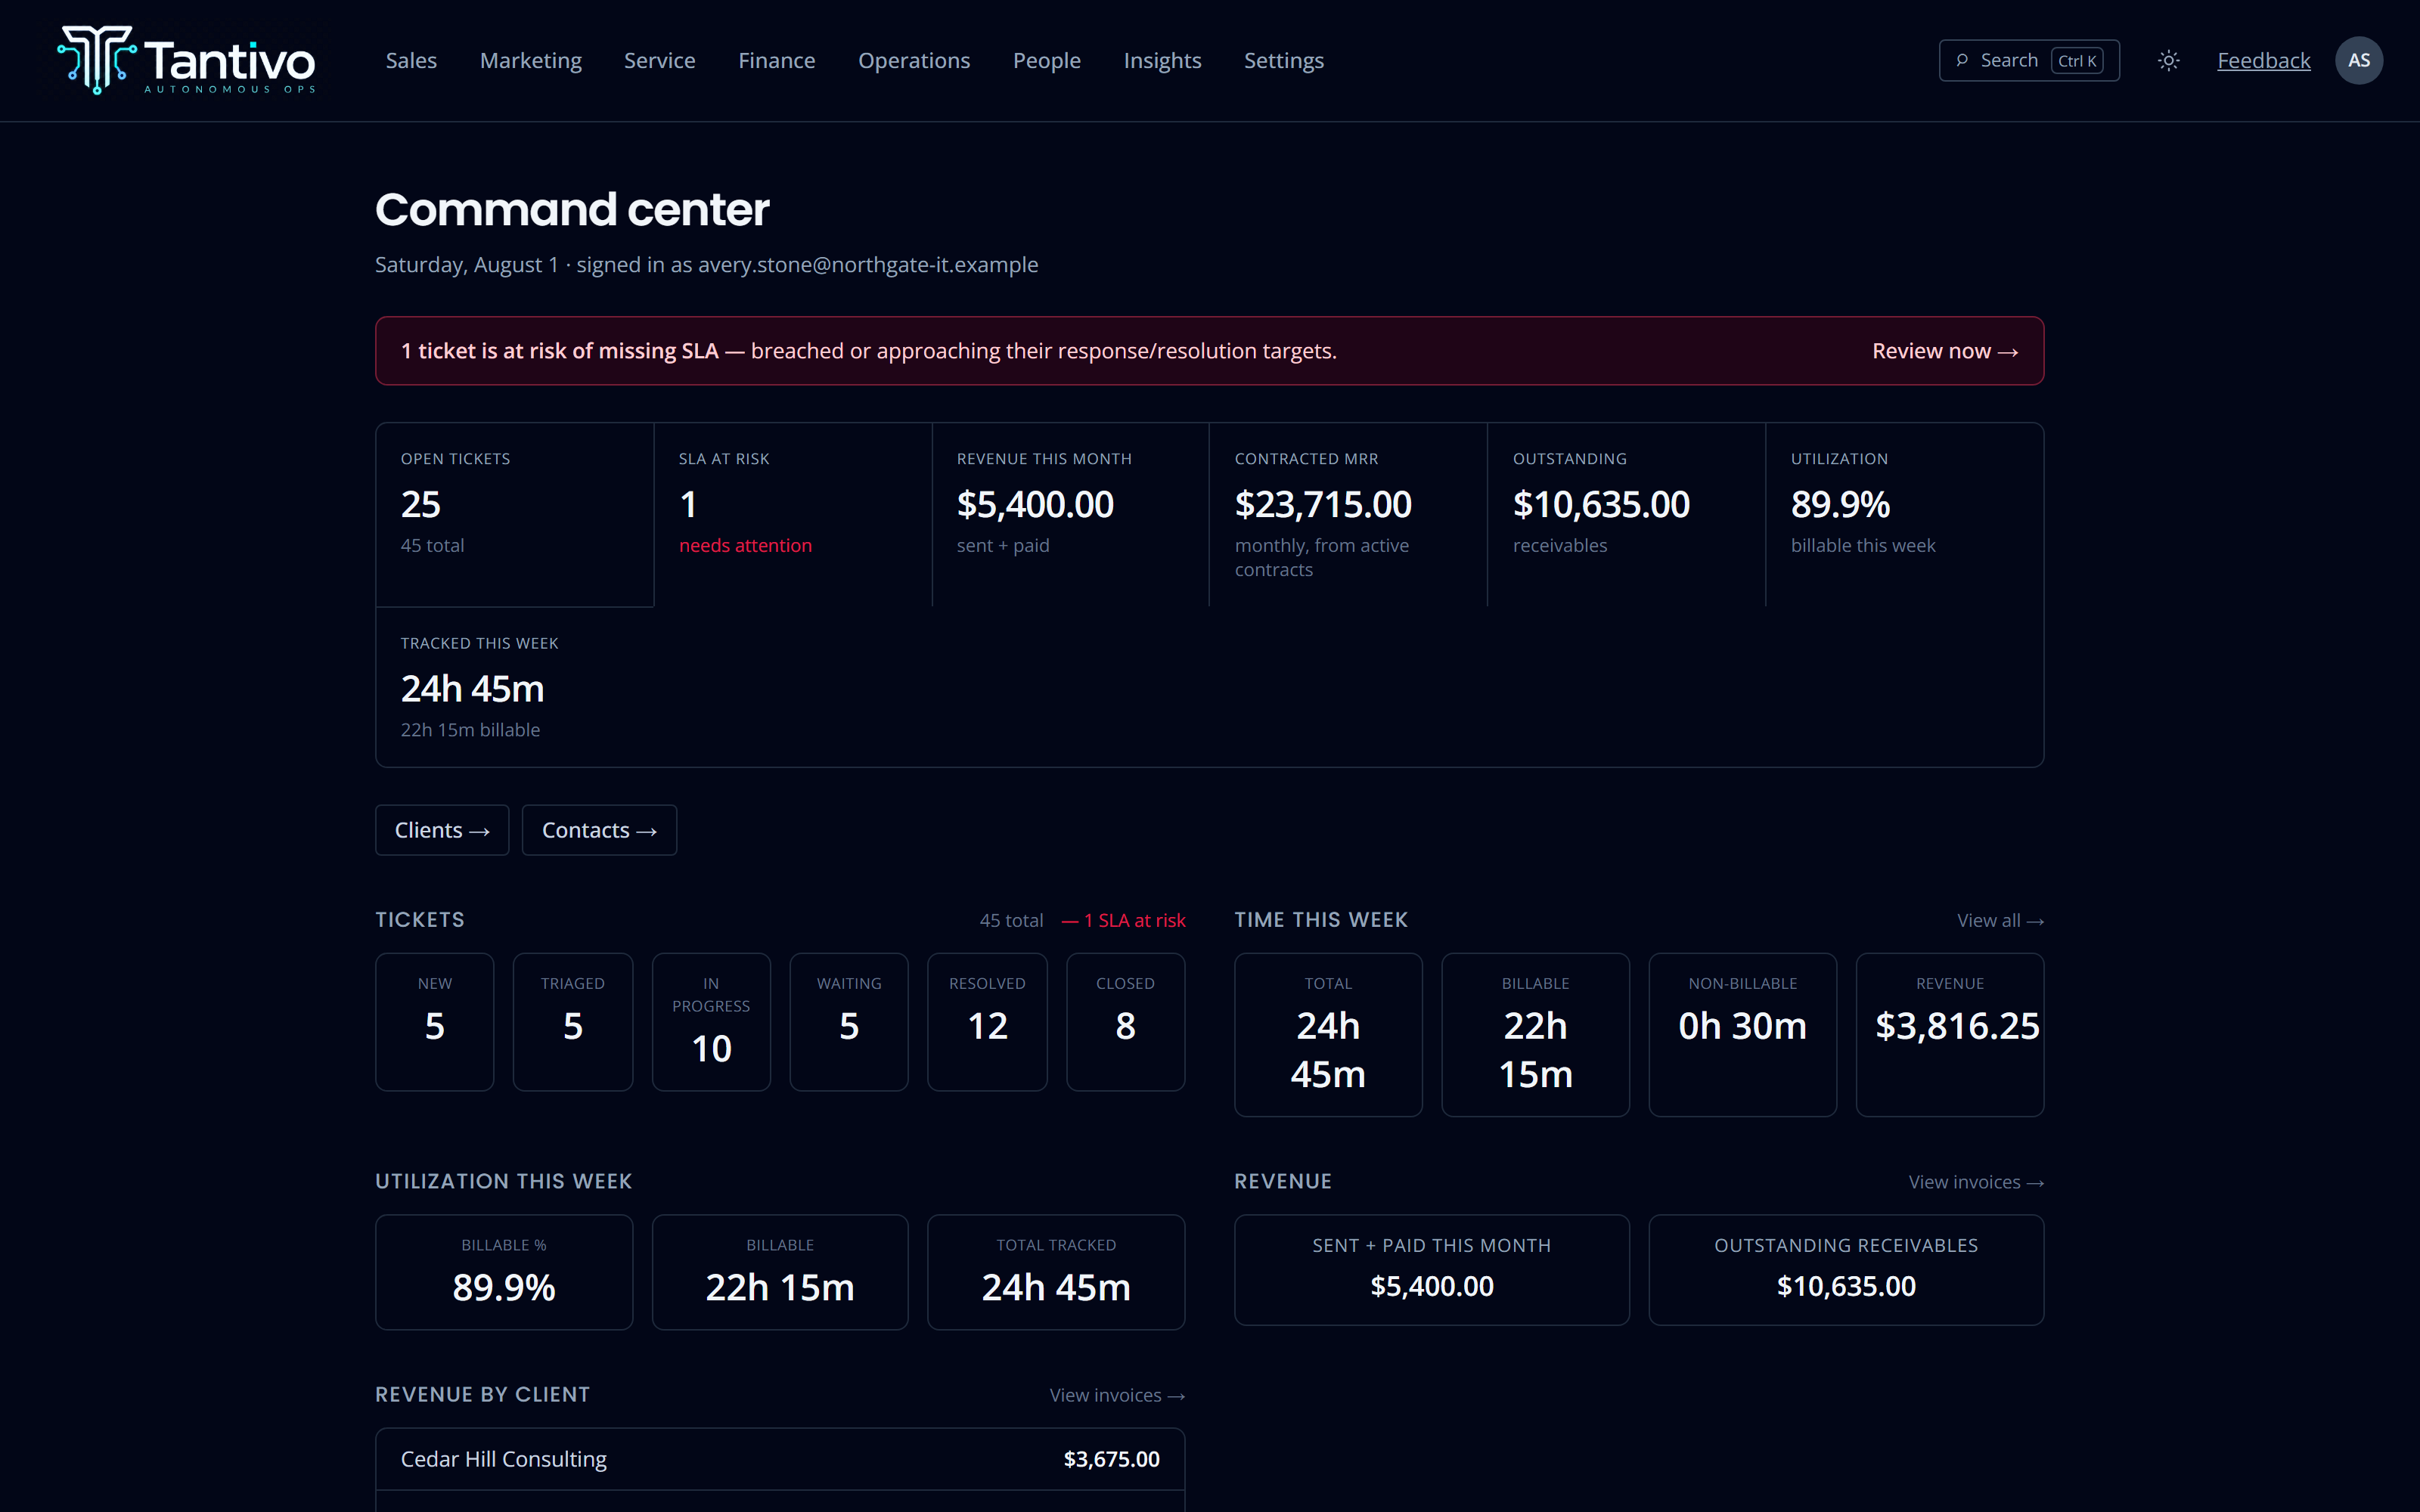
The morning view, in one screen.
Open tickets and how many are at SLA risk. Revenue booked this month. Contracted monthly recurring revenue from active contracts. Outstanding receivables. Billable utilisation and hours tracked this week.
Each of those is derived from the operational records themselves, not from a summary table that a nightly job populates. If somebody logs time at 9:04, the utilisation figure at 9:05 includes it.
- Open tickets by status, with SLA risk called out
- Revenue this month, contracted MRR and receivables
- Billable percentage and tracked hours for the week
- Every tile links through to the underlying list
Where the work actually went.
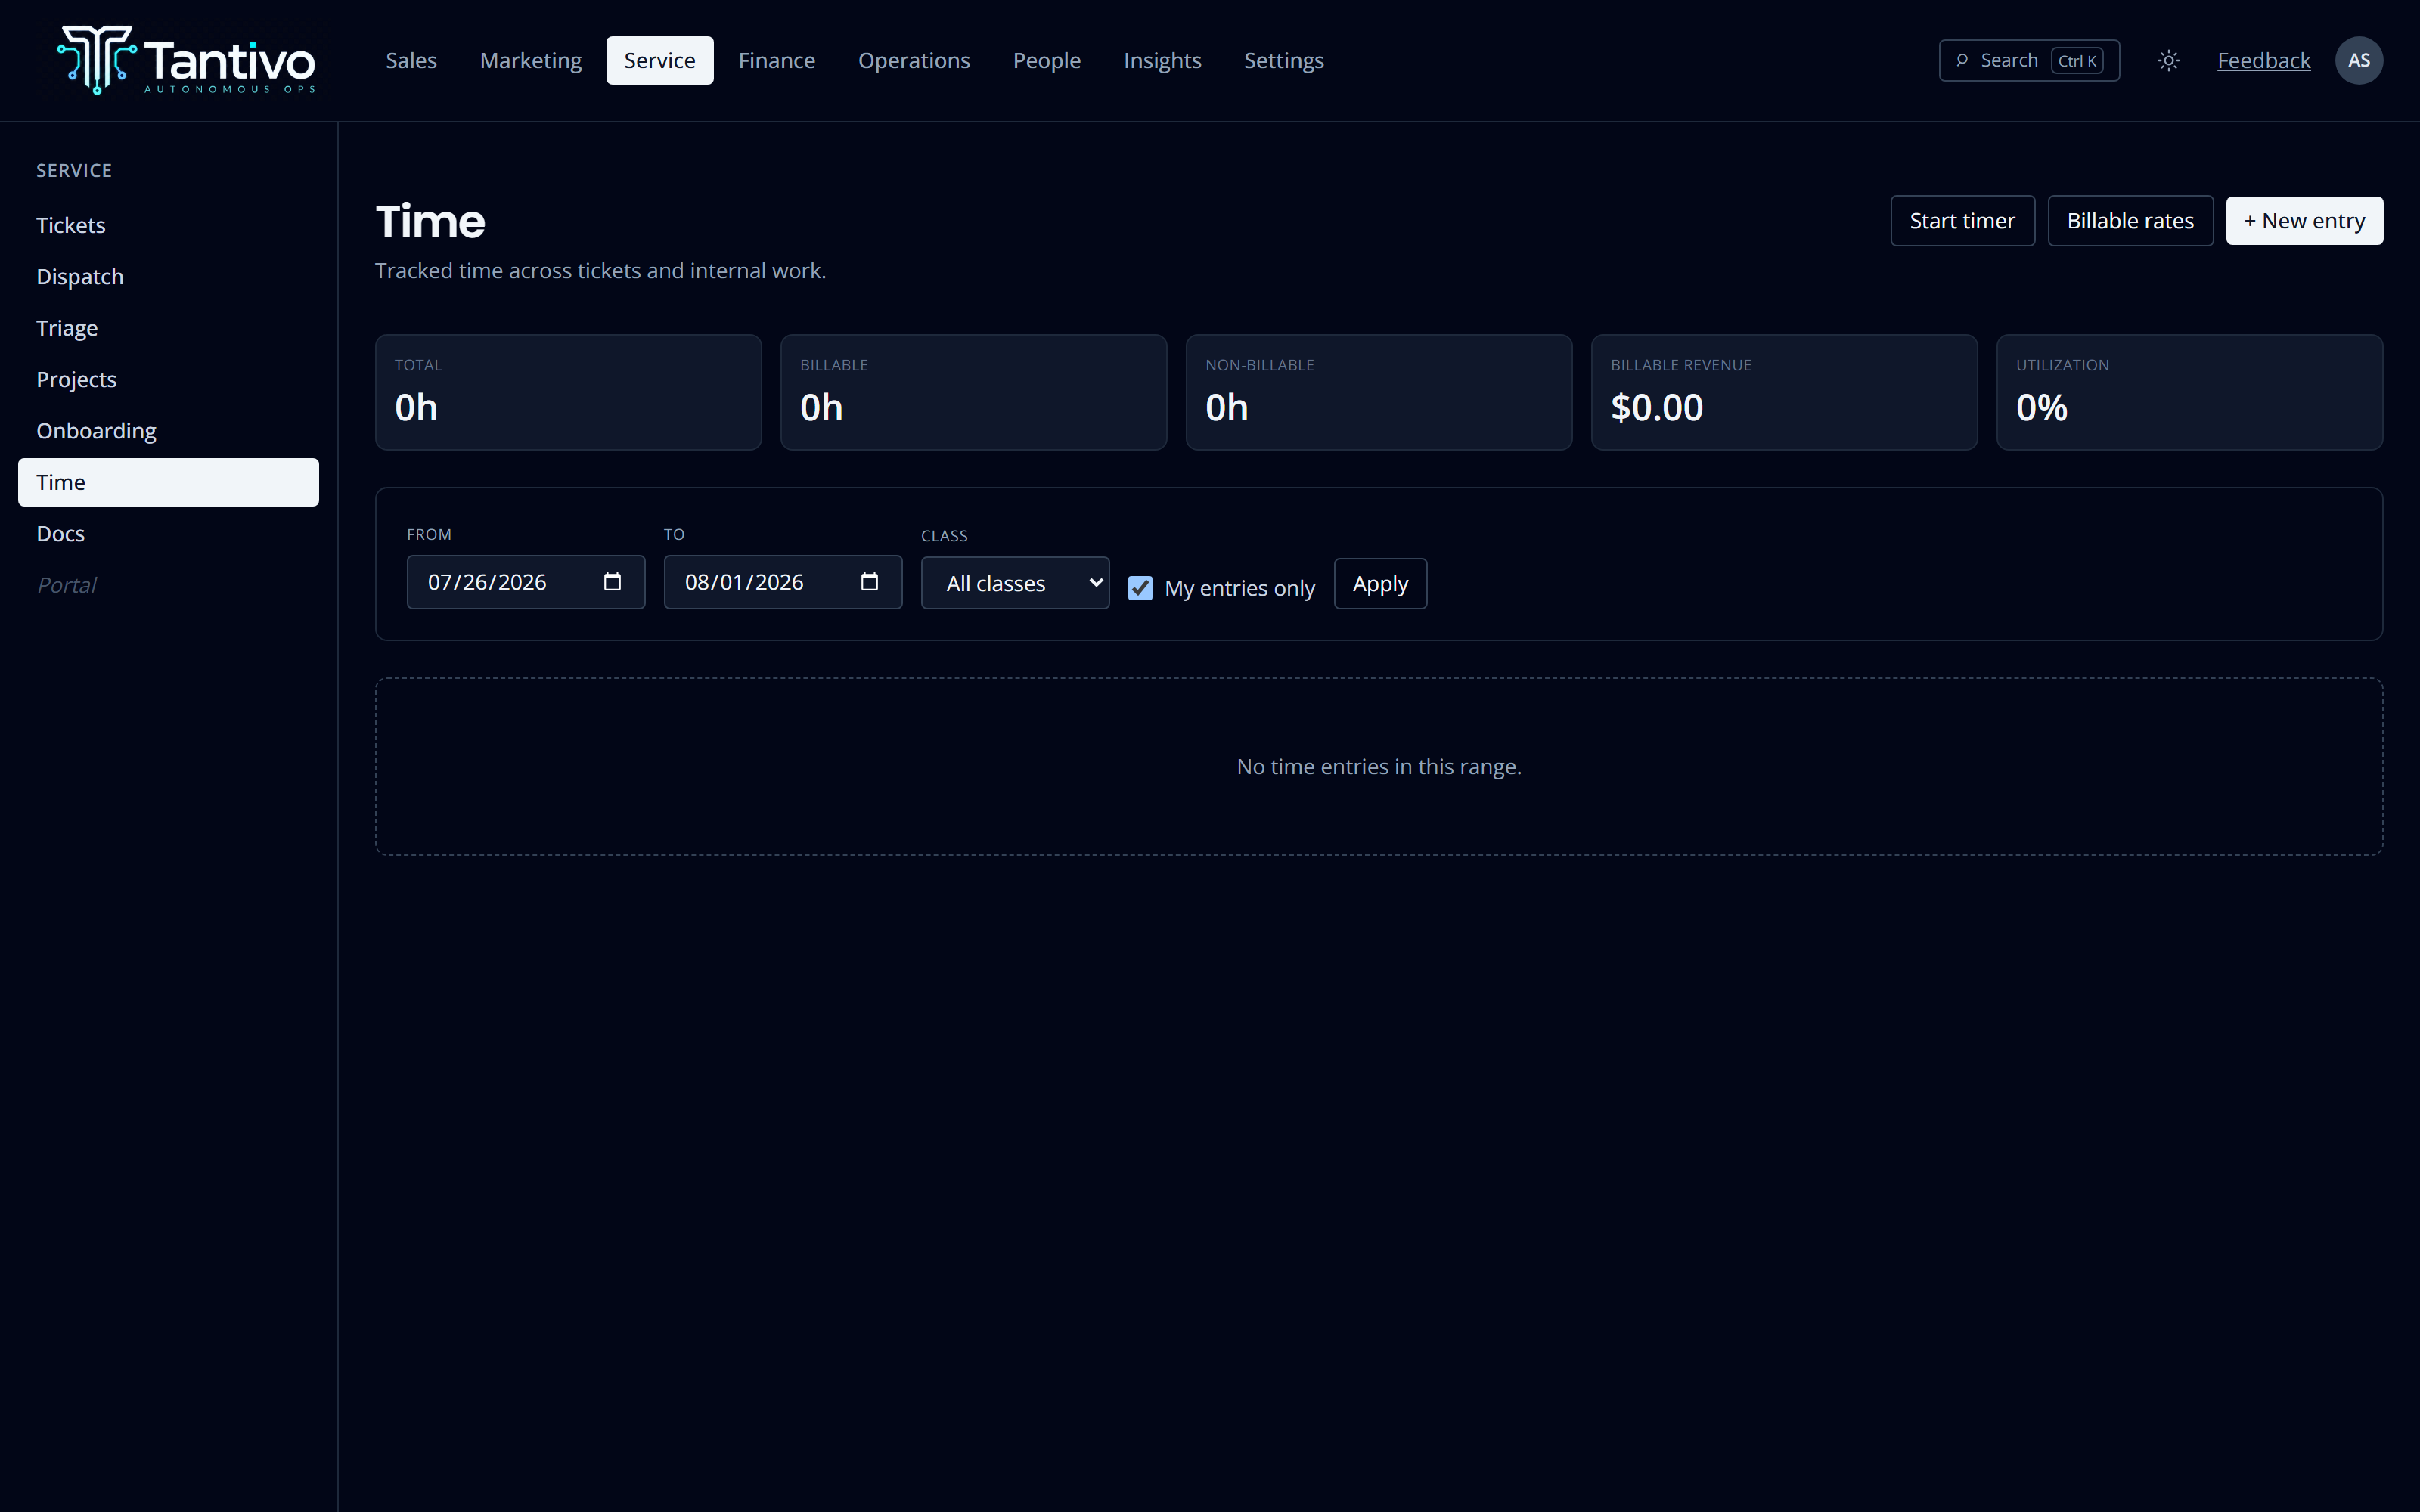
Ticket volume and ageing, time by classification, unbilled hours waiting to be invoiced, and which clients are consuming disproportionate effort against what they pay.
The unglamorous number most MSPs cannot get quickly is the one that matters most: billable versus non-billable versus internal, by person and by client, for a period you choose.
- Ticket volume, ageing and status distribution
- Billable, non-billable and internal time split
- Unbilled time visible before the billing run
- Effort per client against contracted value
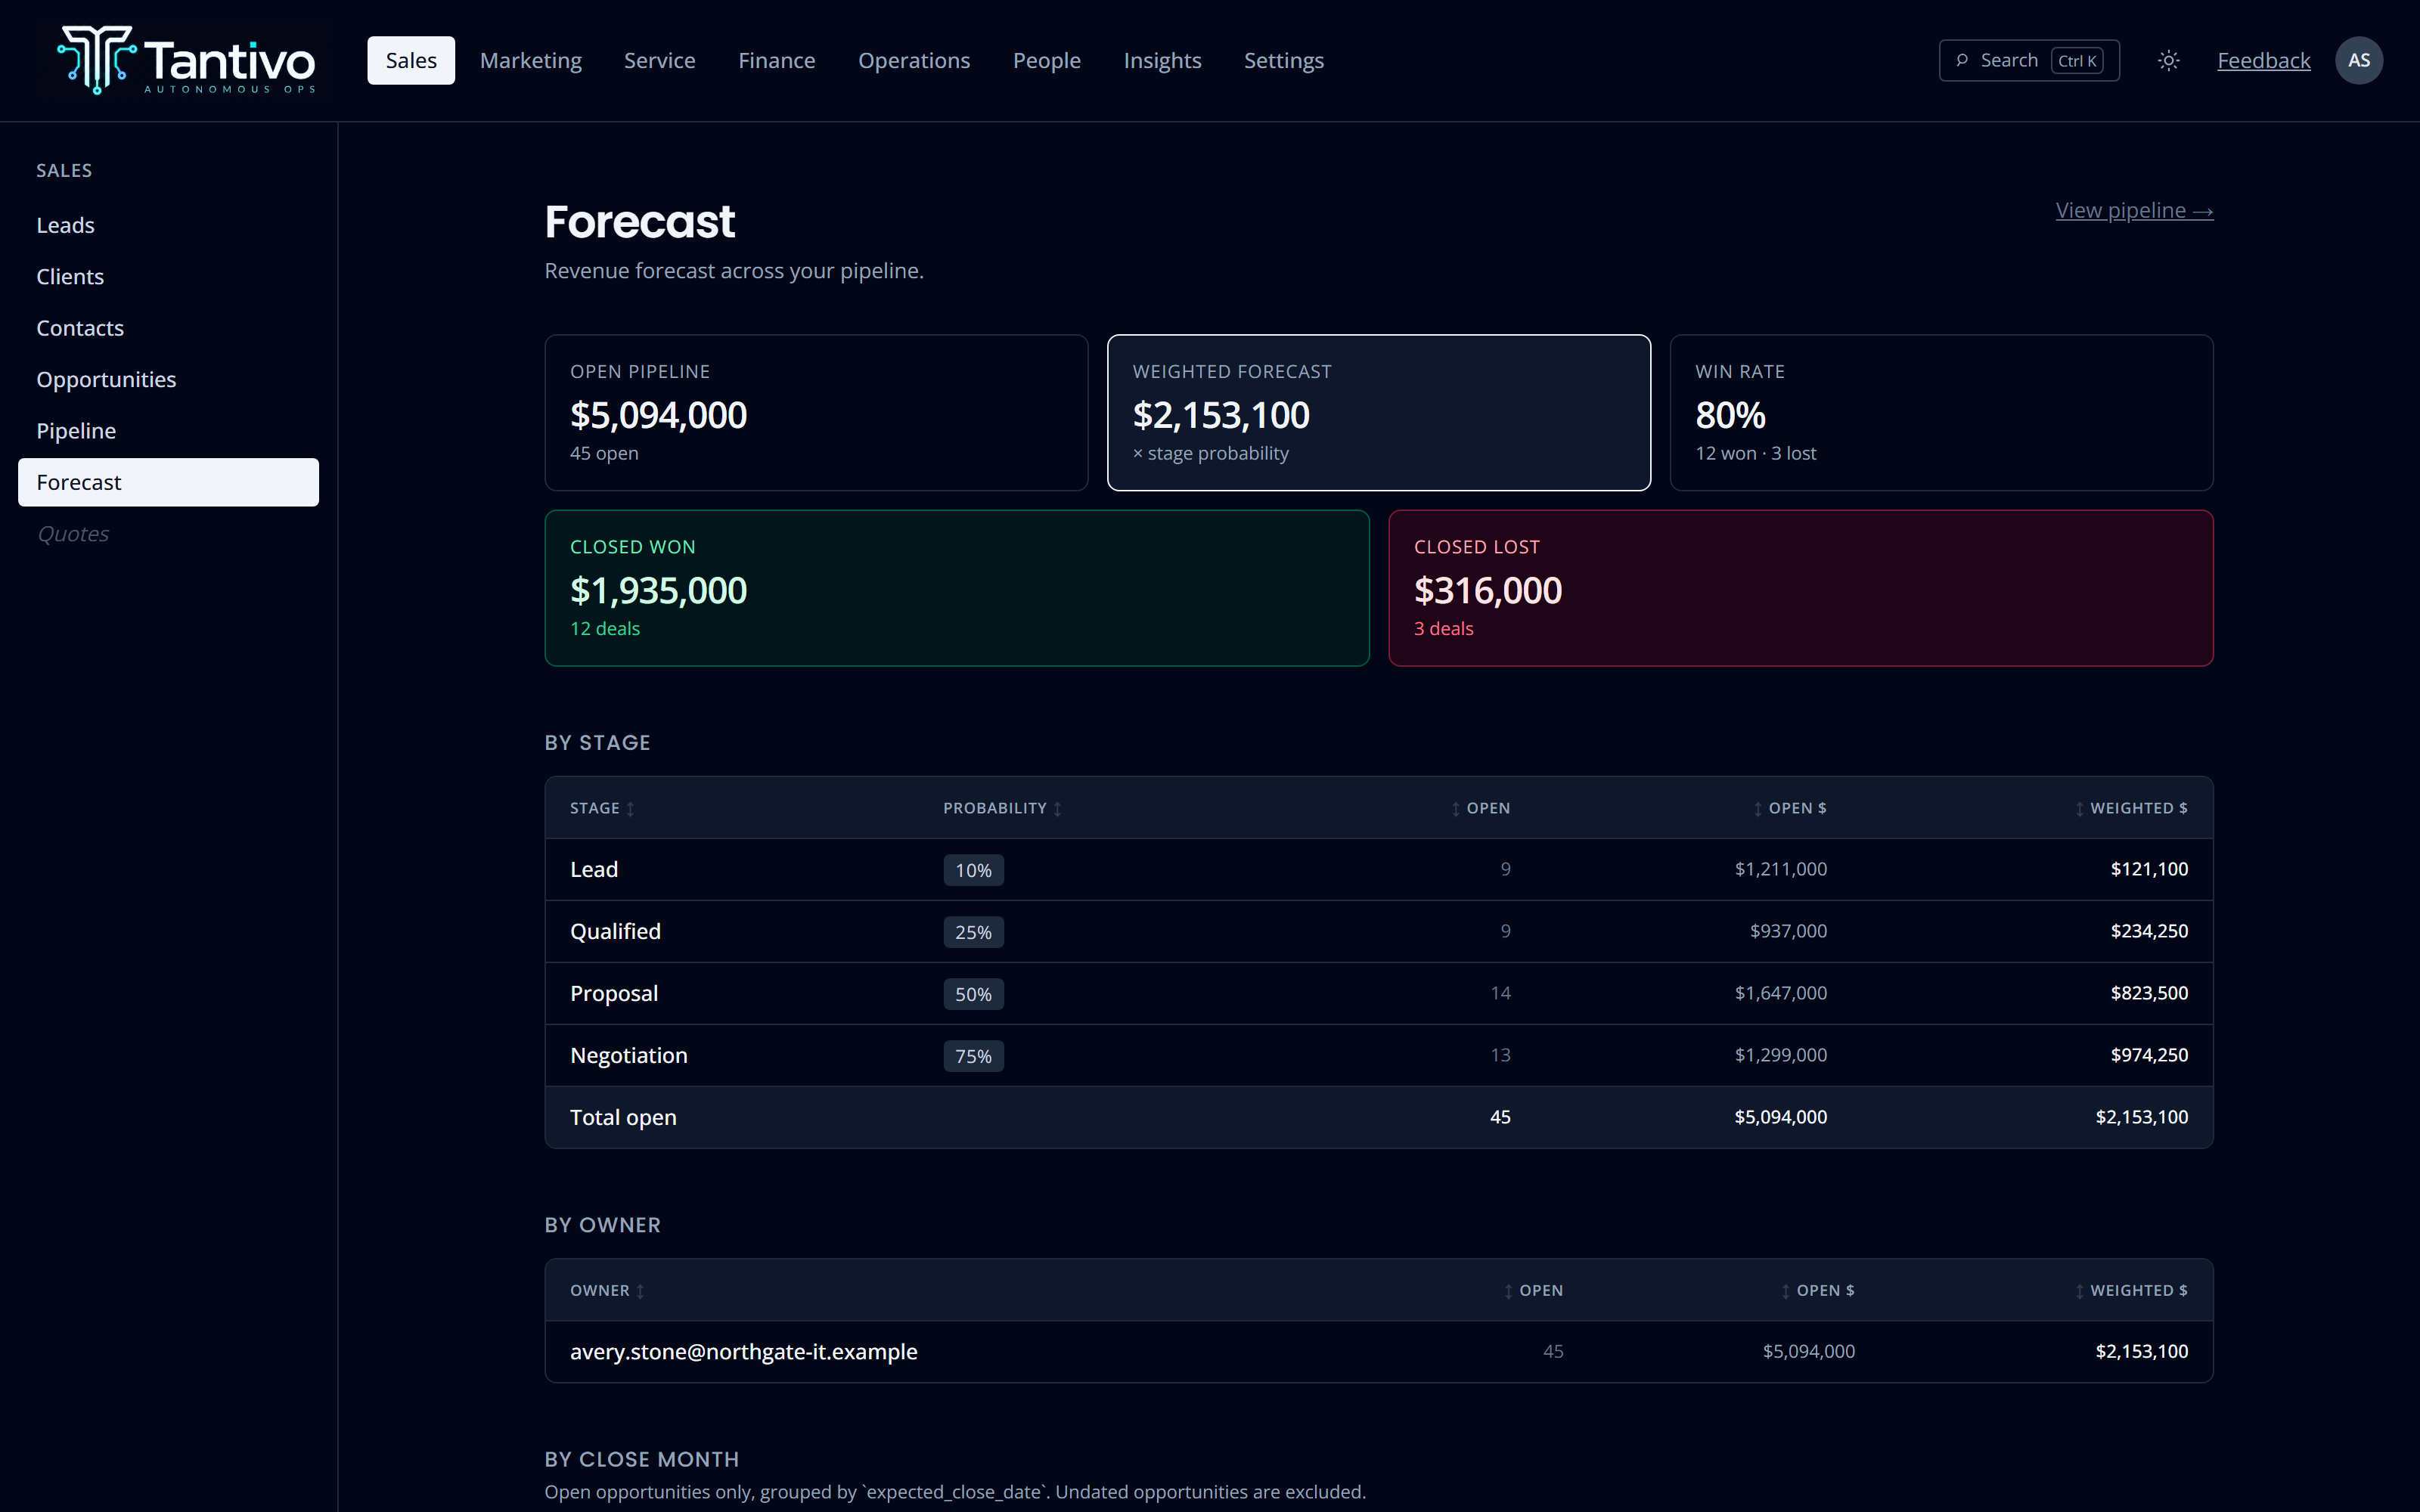
A forecast built from the live pipeline.
The forecast reads the same opportunity rows your salespeople are dragging between stages. There is no export step, no weekly snapshot, and therefore no argument about whose version is current.
Because contracts materialise from accepted proposals, the gap between “forecast” and “contracted MRR” is a real measurement rather than two teams counting differently.
- Weighted forecast from live pipeline stages
- Close-date view by period
- Won deals trace through to the contract they created
- No snapshotting, no stale export
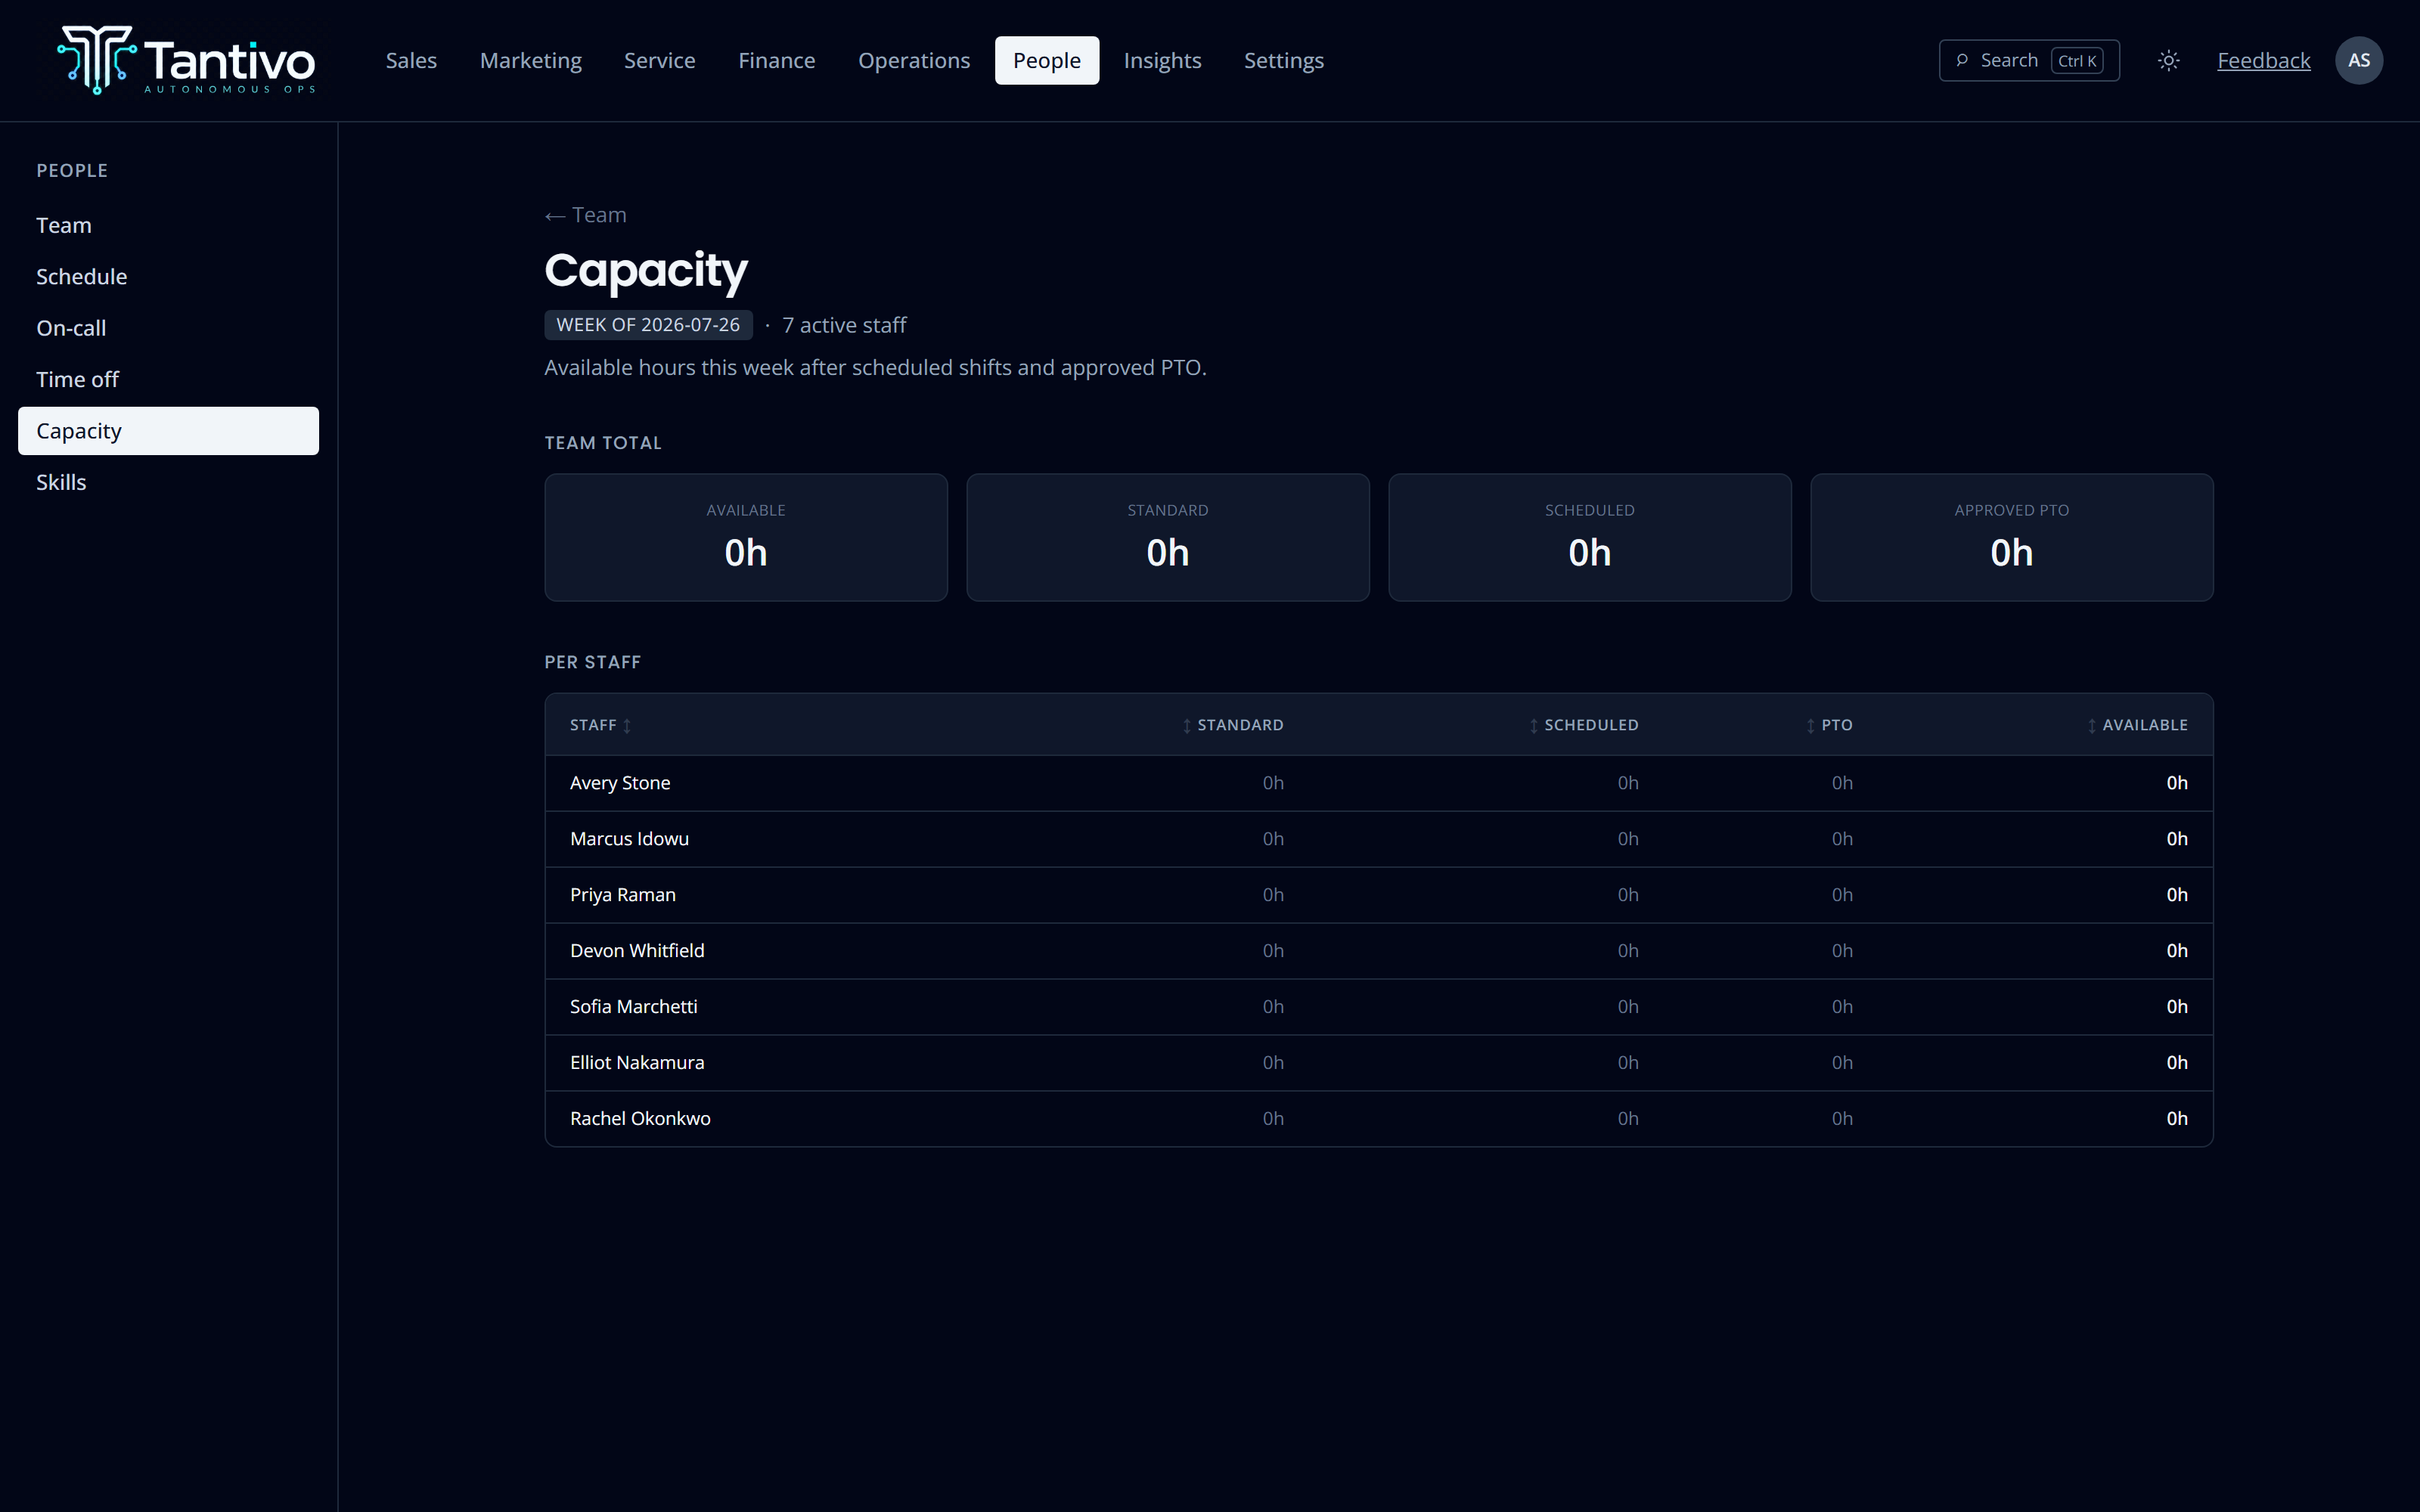
Capacity you can plan against.
Each staff member carries a working-hours schedule, so standard weekly hours are derived rather than typed. Skills, shifts, on-call rotations and approved time off feed the capacity view.
Sensitive employment detail — compensation-adjacent fields, home contact details, time-off requests — is gated to the person, their manager and HR, enforced in the database rather than by hiding a page.
- Weekly hours derived from the actual schedule grid
- Skills feed service-desk assignment suggestions
- On-call rotation surfaces the current escalation target
- Sensitive HR fields gated to self, manager and HR
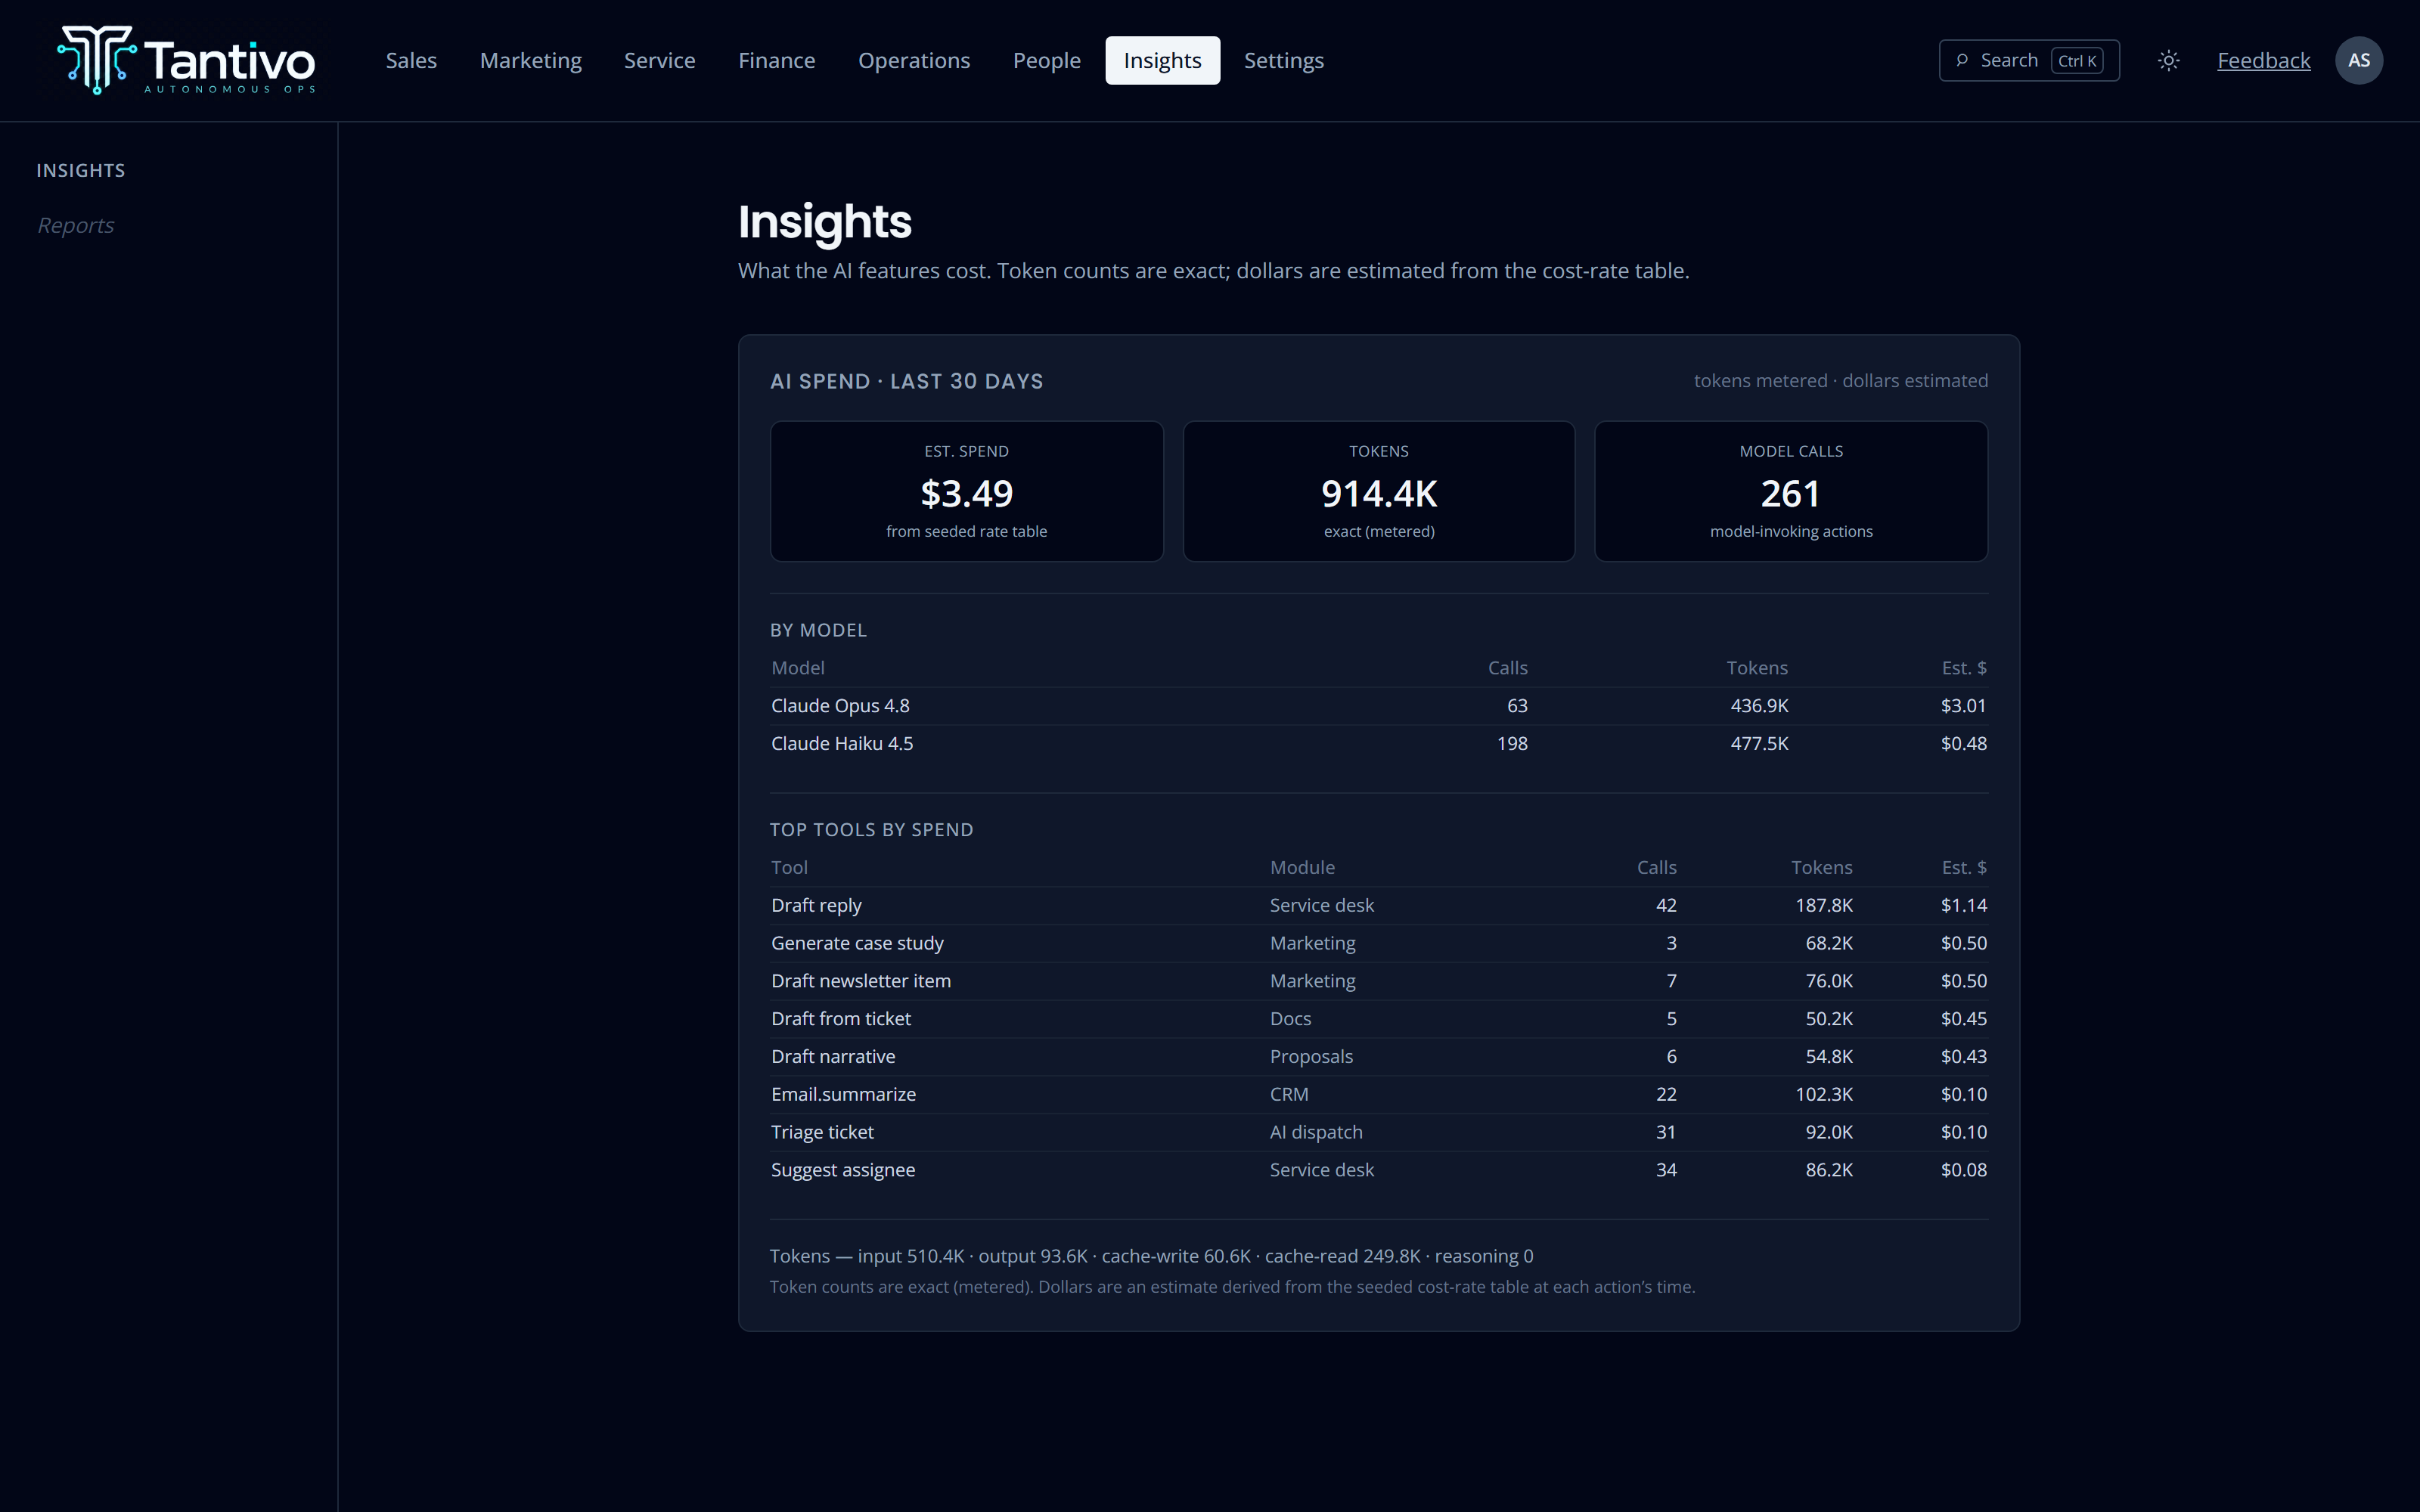
The cost of the assistance, itemised.
Exact metered token counts per model call, aggregated by model and by tool, with an estimated dollar figure derived from a dated rate table. It is a line item you can see, question and act on.
Most platforms bundle AI into the subscription and never tell you what it consumed. If AI is going to be in the middle of your workflow, you should be able to audit its bill like any other supplier.
- Spend by model and by tool over a rolling window
- Exact token counts; dollars labelled as estimates
- Rolls up per tenant, per session and per tool
- Reads the same records that record what the AI did
Metrics are functions over the live tables, not a nightly rollup that can drift.
The reporting module never writes another module’s data. It only reads.
Aggregates run inside your own session — isolated by construction, not by convention.
The underlying rows are yours, and the self-service export includes all of them.
Questions
Can I build my own reports?
Not yet — the dashboards that ship are pre-built rather than assembled from a query builder, and there is no embedded BI tool. What you can do today is export your data and point your own tooling at it. An ad-hoc report builder is a known gap, not a hidden one.
How current are the numbers?
Current as of the moment you load the page. Metrics are computed on read against the live tables rather than materialised on a schedule.
Can we benchmark against other MSPs?
No, and not by accident. Cross-tenant reads are a separate, audited code path that ordinary reporting cannot reach. Your operational data is not pooled into a benchmark product.
Keep exploring
- Service deskTickets, queues, SLA clocks and AI-assisted dispatch.
- CRM & salesLeads, clients, contacts, pipeline and forecast.
- Contracts & billingContracts and tracked time straight through to invoices.
- Client portalA branded, strictly isolated portal for every client.
- AI throughoutRecommend-only assistance with full cost accounting.
Ready to run your MSP at full gallop?
Bring acquisition, delivery and billing into one transparent, AI-native system. Join the waitlist for the private trial.
Prefer email? support@tantivo.ai